CoastWatch UNESCO Bilko Project Module 7
Caribbean Regional Node

Information | Data | Software | Sites | Feedback | News


Bilko3.pdfPart 3
Part1 | Part2 | Part4 | Part5

Introduction to the Bilko for Windows 2.0
image processing software


6. Palettes

This part of the introduction to Bilko for Windows investigates the use of colour palettes in image analysis and how they may be used to convey useful information.

About Colour

In order to understand the use of palettes, it may be helpful to give a brief summary of colour and the way in which the human eye discerns colour. Definitions for the terms used in this exercise will also be given.

The human eye perceives colour by means of light-sensitive receptors in the retina called cones. There are three types of cones. These contain different photosensitive pigments and thus respond to light of different wavelengths. The three different types of cone are broadly sensitive to wavelengths in the red, green, and blue part of the visible spectrum respectively. This system works because all colours that we can see can be reproduced by adding together red, green and blue (RGB) in different proportions. This is known as Young's tristimulus theory of colour.
Red, green and blue are known as primary colours because none of them can be produced by mixing the other two colours. As well as being used by our eyes, these additive primary colours are used in the screens of colour monitors and televisions, which are coated by regularly spaced dots of red, green and blue phosphors that emit light when bombarded by electrons from the red, green and blue guns respectively.

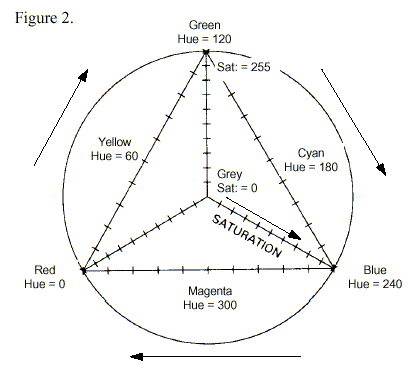
Figure 2 shows the 3 colour theory illustrated diagrammatically as a triangle with the primary colours at each apex. Points along the outlines of the triangle represent mixtures of two primary colours; thus a pure cyan is a 50:50 mixture of blue and green. Points inside the triangle represent mixtures of all three primary colours and include pastel shades such as browns, purples and pinks. Right in the centre of the triangle where you have equal amounts of each primary colour you have the achromatic point where you see a grey. This point is on an axis (the achromatic line) coming out of the page which represents the brightness, or intensity, of the colours (and ranges from black to white).

So far when we have been looking at the EIRE4.BMP image we have just been using this achromatic line to display the pixels at 256 different grey levels (i.e. at grey levels ranging in intensity from 0 (black) to 255 (white)). The terms hue and saturation are explained below.
Colours can also be described in terms of three attributes - intensity, hue and saturation (the IHS system):

Intensity: refers to the brightness of a colour which for 8-bit displays will vary from 0-255.

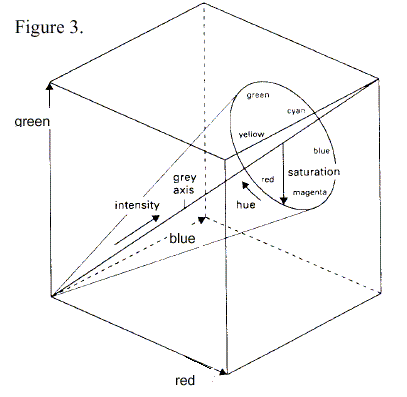
Hue: refers to the relative amounts of two primary colours making up a colour. In the Bilko palette generator hue can take values from 0-359 with primary colours (at full saturation) considered to lie along the circumference of a circle (360-). Red, green and blue are thus each 120- (hue units) apart with yellow, cyan and magenta lying half way between them (Figures 2 and 3).

Saturation: the pureness of a primary colour (expressed as its distance from the central grey point or achromatic line).

Figure 3 is a three-dimensional view of the hue-saturation triangle in Figure 2 to show the achromatic line (grey axis) and intensity cone. Try to relate the elements of the palette generator box below to the diagram above and note that colours are expressed both in terms of amounts of red, green and blue (RGB) and in terms of intensity, hue and saturation. You can set up colours using either system. In the palette box below the colour being set up is white. This is made by mixing red, green and blue in equal amounts at full intensity; thus under the RGB system we see Red: 255, Green: 255 and Blue: 255. Under the IHS system we think of white as a point at full intensity on the achromatic line, that is with a saturation of 0; thus we see Sat: 0 and Val: 255. The hue value does not matter in this case since saturation is 0 and could be any number from 0-359 (in the palette box below it just happens to be 0). If this puzzles you study Figures 2 and 3 again.
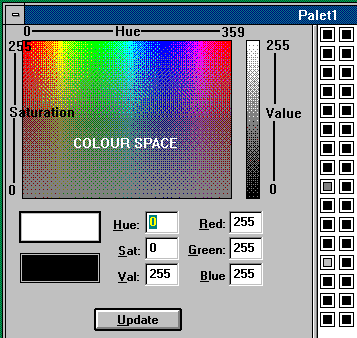
Intensity: In the palette generator intensity is referred to as Value (Val:).

Hue: Red is arbitrarily assigned a hue of 0; green has a hue of 120, and blue a hue of 240. Moving around the circumference of the hue circle in Figures 2 or 3 is equivalent to moving along the top of the colour space rectangle in the palette generator box (left).

Saturation: In the palette generator a fully saturated colour has a saturation of 255, whilst greys on the achromatic line have a saturation of 0. Black thus has a saturation of 0 and a value of 0; white has a saturation of 0 and a value of 255; mid-grey has a saturation of 0 and a value of 127.

Table 1. For reference, the RGB mixtures required to make the main full intensity (Val:=255), pure (Sat:=255) colours are shown below along with the attendant Hue values obtained. To obtain dark versions of the same colours (Val:=127), you would replace the 255 values in the Red, Green and Blue boxes by 127.
Colour
Hue
Red
Green
Blue
Red
0
255
0
0
Yellow
60
255
255
0
Green
120
0
255
0
Cyan
180
0
255
255
Blue
240
0
0
255
Magenta
300
255
0
255
Activity: Open the image file EIRE4.BMP (if not already open). This can be done either by clicking on the File menu and selecting it from the list of the four most recently open files (if it is there), or by clicking File, Open and using the dialog box. When the original unstretched EIRE4 image is displayed you should then open your manual stretch document EIRE4.STR. Again this can either be done by clicking on the File menu and selecting it from the list of 4 most recently open files (if present), or by clicking File, Open and using the dialog box. By default this shows image files, so you need to select STRETCHES (*.str) in the List Files of Type: box in the File Open dialog box. A list of available stretch documents will be displayed. Double-click on EIRE4.STR to open and apply the stretch.
Note that when your stretch document is opened while EIRE4.BMP is the active window, the stretch is by default automatically applied to the EIRE4.BMP image (if the Apply checkbox in the File Open dialog box is checked) which immediately becomes more constrasty with the land becoming black. Activity: To check how the image is stretched you should click on the image to make it the active window and then click on File, New and select STRETCH Document in the New dialog box. You will see a manual stretch identical to that which you saved. To look at the actual stretch document which you saved, click on the new stretch to make sure that it, and not the image, is the active window. Now click on File, Open and open EIRE4.STR again. This time you see the graph of your stretch because an image which it can be applied to is not active. Compare the saved stretch and the one based on the image. Close the two stretches. Before assigning colours to various pixel brightness values in the stretched image it is useful to view a histogram of the image and to use this to help to select how to apply colours. Activity: To view a histogram of the stretched EIRE4.BMP image, click on the image window to make it active and use <CTRL>+A to select the whole image. Now click on File, New and select HISTOGRAM Document in the New dialog box. Since all land is displayed with a DN of 0 there are over 70,000 pixels with value 0 in the manually stretched image so the histogram is not very well displayed. To adjust the scales so that you can see the distribution of the water pixels, click on Options, Scale. In the Scale dialog box you can either set Maximum:to 4000, Major Unit: to 1000 and Minor Unit: to 1000, or just click on the Ignore zero box, and click on  to show the improved display. Size or move the histogram window so that you can see both it and the image clearly at the same time. In the histogram you can clearly see the distribution of the brightness values of water pixels. The long tail of low frequency pixel values to the left of the histogram (0-150 DN) represent freshwater and near coastal water pixels. Before continuing, minimise the histogram window. Activity: Click on the EIRE4.BMP image to make it active and then click on File, New and select PALETTE Document in the New dialog box. A palette generator box like that discussed earlier appears. You will see: a representation of colour-space, boxes indicating colour values under the HSI and RGB systems and to the right a grid of 256 cells. If the 256 cells are not arranged as a grid of 16 x 16 cells adjust the size of the palette generator window until they are. This makes it easier to work with them. The instructions below assume this layout. We will now explore the palette generator. Activity: Click on the top left cell which should be black. The cell you have selected should then be the only one with a box around it. The HSI and RGB boxes change to show what its colour is. Since it is black all values are 0. Click on the bottom right hand cell (cell 256). Since it is white the Value:, Red:, Green:, and Blue: boxes will show 255 whilst the Hue: and Saturation: boxes will show 0. Click on the right hand cell eight rows down (128th cell) which shows the "colour" displayed for pixels with a DN of 127.

Question 4: What are the Hue, Saturation, Value, Red, Green, and Blue values displayed for this cell? Answers

Activity: With the 128th cell selected, position the mouse pointer in the Colour Space area and click. Depending where you have pointed the colour of the upper rectangle beneath the left hand side of the Colour Space area will change to the colour to which you have pointed. At the same time the hue, saturation, and red, green and blue boxes will change their values. However, the Value: box will remain set at 127. Explore Colour Space briefly by clicking in different parts of it and noting how the hue, saturation and RGB mix change.

It is particularly instructive:

i) to click at the top left of Colour Space and holding down the left mouse button to slide the pointer along the top of Colour Space (Sat:=255) and see how both the Hue value and colour in the upper rectangle changes; and

ii) to click at the bottom left of Colour Space and holding down the left mouse button to slide the pointer up an down the left hand boundary of Colour Space (Hue:=0) and see how Saturation changes.

When you have seen how Colour Space is structured in terms of Hue and Saturation, click on cell 127 again. Now position the mouse pointer over the intensity or value bar to the right of the Colour Space area and click. Note that the numbers displayed in the Value:, Red:, Green:, and Blue: boxes change in unison. Now hold the left mouse button depressed and slide the mouse pointer up and down the intensity bar. This is equivalent to moving up and down the achromatic line or grey axis of Figure 3 and the values change from 0 to 255 as the colour in the upper rectangle beneath the Colour Space changes from black to white.

The brief exploration of the palette generator above should give you a reasonable grasp of the concepts behind the palette generator. We will now apply this knowledge to put some colours on EIRE4.BMP. Firstly, it seems sensible to colour all the land in green. At present all the land is black with a DN value set to 0 by the stretch. Thus all we have to do is make the first cell of the palette dark green. Activity: Click on the first cell (cell 0) in the top left hand corner of the 16 x 16 array. All values (except Hue:) should be zero. We want a dark green so click on the Green: box and type in 127 to indicate a half-intensity pure green. Note that as you type in, the other boxes change so that Hue:=120, Sat:=255 and Val:=127. This makes sense because under the HSI system, dark green is a fully saturated colour with a hue of 120 and intensity of 127. Click on  to effect the colour change and note that cell 0 now shows as dark green. Congratulations! You have now succeeded in making your first change to the palette. To apply this change to the image you need to copy the changed palette document to the image. Activity: To apply the altered palette to the image, click on the copy toolbar button , then click on the EIRE4.BMP image and click on the paste toolbar button . All the land areas are now coloured dark green. In this exercise we will assign 7 colours to the remaining water pixels in a series going from warmer (dark on AVHRR thermal images) to colder waters (bright on AVHRR thermal images). The colour sequence chosen is deep red, yellow, orange, bright red, magenta, blue, cyan. Firstly, we will inspect the histogram to see how we might distribute the colours to the pixel DNs. Activity: Double-click on the minimised Histogram icon of the stretched image and position the cursor on a DN value 0. On the right of the Status Bar you can see that about 55% of the image pixels are land. The remaining 7 colours thus need to be distributed through the remaining 45% of pixels, thus each colour should represent roughly 6% of the pixels. Place the mouse pointer on a DN value of 1 and drag the mouse to the right until the Status Bar indicates that about 6% of pixels are covered. This takes you to a DN value of around 143 (the first 9 rows of cells on the palette). Click on a DN value of 144 and drag the mouse pointer to the right again until the Status Bar indicates about 5-6% of pixels are covered. This takes you to around a DN value of 175 (about two rows of cells on the palette). This leaves some 80 cells (five rows on the palette) for the remaining five colours so we will assign one colour per remaining row. Minimise the histogram document.
Our colour palette plan for the stretched image can be summarised as follows:
Stretched

Image DN values

Number of rows on 16 x16 cell grid of palette generator
Colour to be assigned
0
Cell 0 only
Dark green
1-143
Rows 1-9 (apart from cell 0)
Dark red
144-175
Rows 10-11
Yellow
176-191
Row 12
Orange
192-207
Row 13
Bright red
208-223
Row 14
Magenta
224-239
Row 15
Blue
240-255
Row 16
Cyan

Note: Normally you EITHER stretch images to reveal detail OR use a palette to reveal features of interest and would NEVER mix the two methods.

Activity: Click on the palette generator. Then click on the second cell (cell 1) and holding the left mouse button down drag the mouse down and right to the cell on the right had end of row 9 (cell 143), then release the mouse button. The first nine rows apart from the green cell will now be highlighted (will have boxes around them). The upper rectangle under the Colour Space will be black and the bottom rectangle mid-grey. Click on the upper large rectangle under the left side of the Colour Space and then type the value 127 in theRed: box, 0 in the Green: box and 0 in the Blue: box. The upper rectangle turns dark red. Now click on the bottom rectangle and do the same. It too turns dark red. Click on the  button and all the highlighted cells turn dark red.

Using the same technique, methodically set up the six colours for the remaining rows of cells. Refer to Table 1 for the RGB values for the main colours and note that orange can be made of Red:=255, Green:=127 and Blue:=0 and should have Hue:=40. When all colours have been updated on the palette, copy the palette and paste it to the image. When you have done this successfully, minimise the palette which becomes a Palette icon (see right for Windows 3.1 version) near the bottom left of the workspace.
The image is now thematically coloured with land green, and water ranging from dark red and yellow, where warmest, to blue and cyan where coldest. The front off Malin Head where warm and cold water meet is very clear. Note that the colour bar beneath the image shows what colours are assigned to the original pixel DN values in the image. Thus pixels with DN values between 0-62 are green, etc. Activity: Restore your palette either by double-clicking on it or by clicking on it once and then clicking Restore. You will need it later in the Introduction so now save it as a Palette document called EIRE4.PAL using the Save option in the File menu. Once it is saved, close it.
 
7. View menu


As the name suggests, the View menu provides options which alter the displayed image. The options are:

¸ Zoom

¸ Reflect, and

¸ Coords (discussed in Part 5)
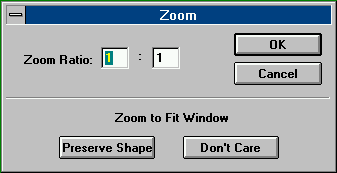
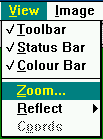
Zoom allows an image to be magnified or reduced. Reflect allows you to reflect the image about the x-axis, y-axis or both axes. The reflect option is useful for images taken by satellites moving from south to north whose images appear upside down according to our normal conventions. It will not be considered further in this introduction.

The Zoom option allows the image to be temporarily magnified so that areas of particular interest or individual pixels can be examined more easily, or temporarily reduced so that more of a very large image can be seen on the monitor at one time. Activity: Click on the newly coloured thematic image of EIRE4.BMP and select the Zoom option from the View menu. Set the first Zoom Ratio: box to 3 and click on  to carry out the zoom. The image will not now fit on your screen all at once but you can move around it using the vertical and horizontal scroll bars. At this magnification you can clearly see the individual 1.1 x 1.1 km pixels. To reset the image back to 1:1 magnification, select View, Zoom again and reset the first Zoom Ratio: box to 1.

Short-cut: Double-clicking on the image will also zoom in. Double-clicking on the image whilst the <CTRL> key is depressed will zoom out. Each double-click zooms in or out one step. Experiment with this and note that you can always check the current zoom ratio by selecting View, Zoom.

8. Transects

The Transect option allows you to view a graph of pixel brightness values along a transect drawn between any two points on an image. This is shown as a graph of pixel DN values on the y-axis versus number of pixels along the the line between the points. Transects can be used to study how pixel values change between different areas of the image.
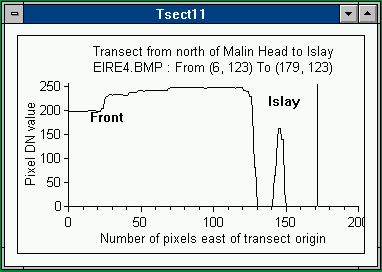
Activity: Using the stretched image of EIRE4.BMP, click on the Transect button , or select the Selection, Line option from the Edit menu. Start the transect north of Malin Head (Figure 1) near coordinates (5, 120) and drag the mouse pointer to the middle of Islay island (Figure 1). This draws a transect which passes throught the oceanic front and ends on land. Now click onFile, New and select a TRANSECT Document (the default) from the New dialog box. The front shows up as a sudden increase in pixel DN values whilst the land (whose pixel values have been mapped to 0 by the manual stretch) is where pixel DN values suddenly plummet to zero.

Activity: When you have finished looking at the Transect document, close it. Similarly close the coloured thematic image of EIRE4.BMP. You do not need to save it as you can quickly recreate it from EIRE4.BMP, using the stretch saved in EIRE4.STR and the palette saved in EIRE4.PAL.  
Answers to Questions - Part 3

Question 4

This is a mid-grey so Hue:=0, Saturation:=0, Value:=127 and Red:=127, Green:=127 and Blue:=127.


^ Back to main page Back to Educational Res. USDOC | NOAA | NESDIS | CoastWatch