 |
 | XBT Applet Usage |
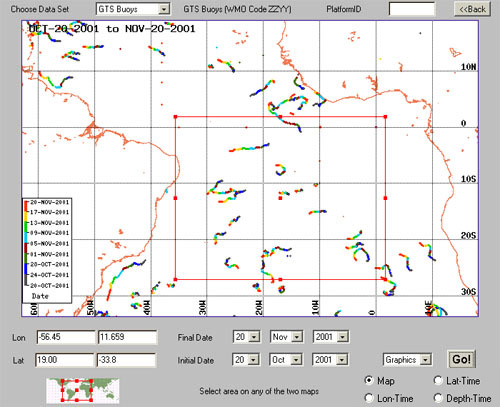
This interface displays XBT data stored in the databases of the Atlantic Oceanographic and Meteorological Laboratory (NOAA/AOML) and GTS data from NOAA/NOS.
There are 5 data categories available at the moment:
- XBT AOML - Atlantic XBT data from the main AOML Database. Profiles before 1995 have passed different quality-control tests and are supposed to be clean.
- XBT NCEP - NCEP XBT data.
- GTS Drifters - Reports from the Global Telecommunications System (GTS) with the BUOY header.
- GTS XBT - Reports from the GTS with the BATHY header.
- GTS CTD - Reports from the GTS with the TESAC header. Argo data are included in this section.
- Hurricane - Drifter data from the Hurricane Array deployed in the Tropical Atlantic. Users will have also access to the storm track database to facilitate comparison between both datasets. Symbol legend: Hurricane/Typhoon;
There are four possible outputs:
- Graphics - Image is displayed in the applet.
- Data - Users can retrieve the data in ASCII format.
- GIF
You can click and drag the mouse on either of the displayed maps to select
the area of interest. The 'Go!' button launches the CGI which generates the
results.
Please, address your questions or comments to Joaquin A. Trinanes
 |
Back to main page | USDOC | NOAA | AOML |